Taiwan drone no-fly zone dataset
All 22 counties' restricted-airspace notices normalised into one open GeoJSON dataset — ~5,000 sites, with the time dimension no official source publishes.
The data existed, but nobody could use it.
Under Taiwan's regulations, drone flight restriction zones are managed and published independently by each local government. Every county does it differently — ODS here, XLSX there, scanned PDFs elsewhere, coordinates in degrees-minutes-seconds, numbering schemes that collide between counties.
But the regulation doesn't require local governments to retain or publish historical records — which means some counties' data only shows the current rules, with no way to see how the boundaries have changed.
The Civil Aviation Administration runs a national map, but it's a single live snapshot: it shows you where you can't fly today, and nothing about how that changed. For anyone trying to understand how restricted airspace is actually expanding — researchers, civil defense planners, drone operators, journalists — there was no answer, because no one was keeping the history.
And when a boundary change becomes disputed, can we actually pinpoint the difference between what it was and what it is now?
Normalise everything, and keep every version.
- Collected the original government notices for all 22 counties, preserving each source file exactly as published so results stay auditable.
- Built a pipeline converting ODS, XLSX and OCR'd PDFs into standard WGS84 GeoJSON, including automatic correction of sources that stored coordinates latitude-first.
- Designed an ID scheme mapping a global UID to each government's original notice number, so records stay traceable and don't collide across counties.
- Merged snapshots into a temporal format where each site carries its own history[] — first seen, last seen, and every status change.
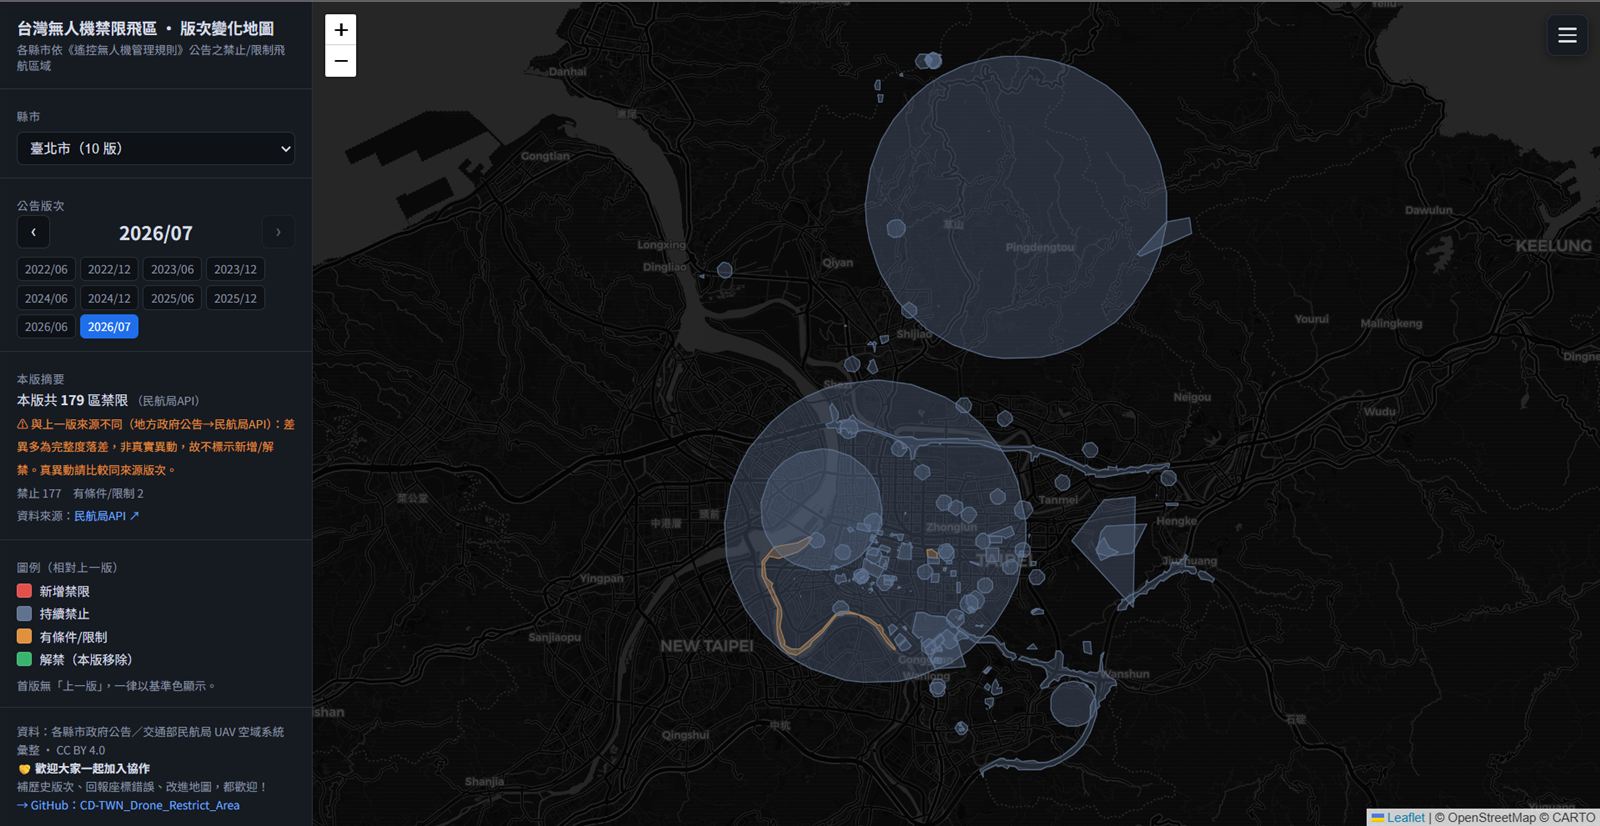
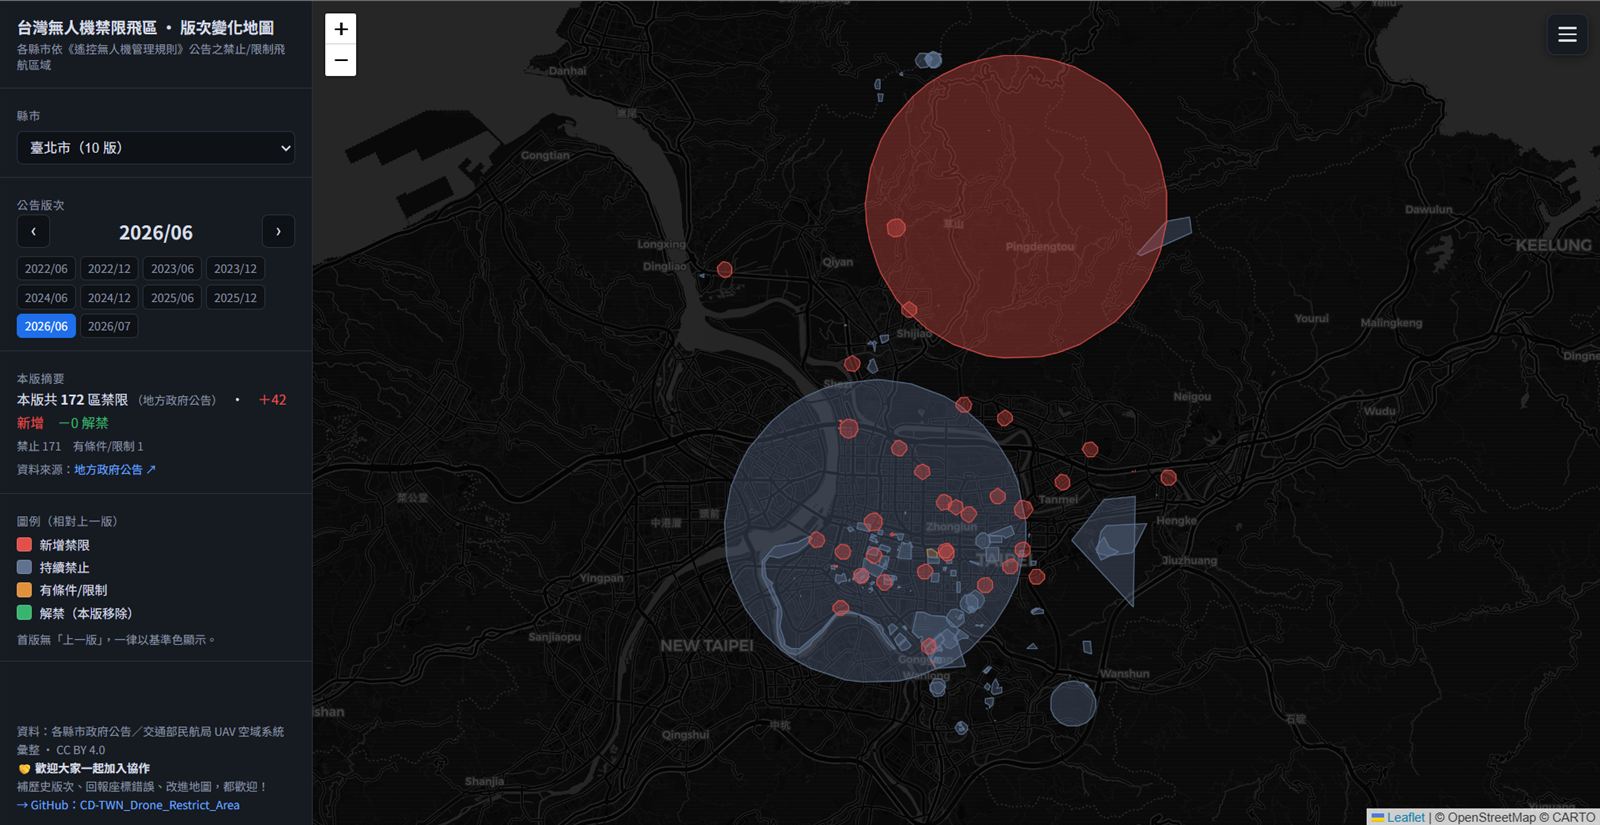
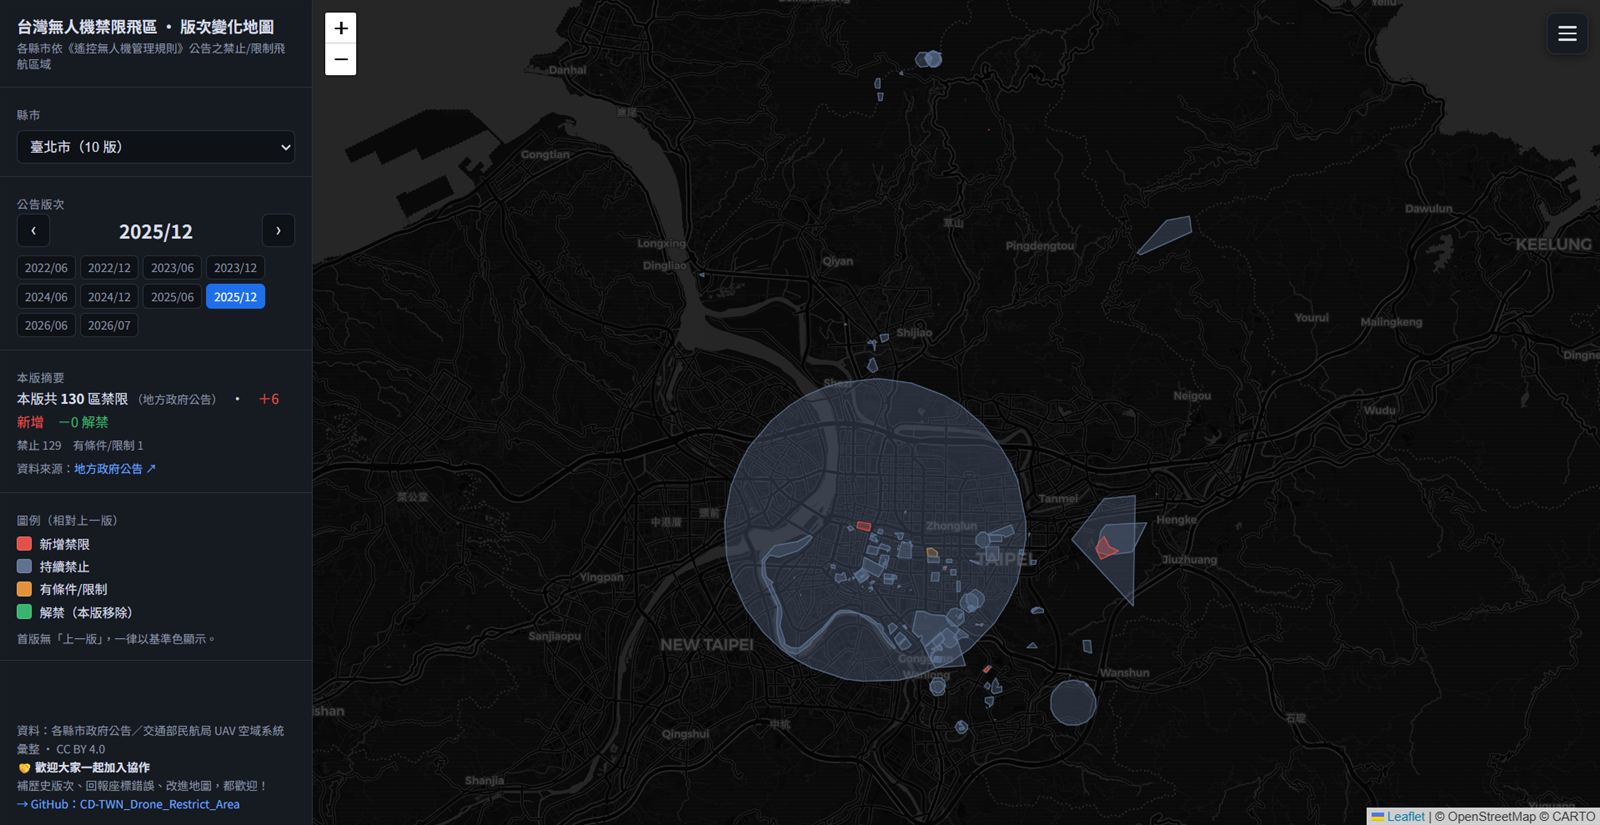
- Built an interactive Leaflet map that pages through published versions, showing both the change (newly restricted / lifted) and the full picture at that version.
- Documented the limits honestly: only Taipei has a true continuous series, so cross-source differences are flagged as completeness gaps rather than miscounted as policy changes.
An open dataset that didn't exist before.
- All 22 counties covered — roughly 5,000 restricted facilities plus 24 corridors, in one consistent schema.
- Taipei reconstructed across 9 published versions from 2022 to 2026, giving a real four-year view of how restrictions grew.
- Released openly: data under CC BY 4.0, code under MIT, fully rebuildable from source with one command.
- Usable straight in QGIS, web maps, or any analysis script — no scraping, no cleanup.
The dataset is maintained and open to contributions; the biggest remaining gap is historical versions from counties that haven't digitised their archives.
- This is an open-source project — discussion and contributions are welcome via GitHub PR.
- Historical data outside Taipei is sparse. If you're able to help source it, please get in touch.